Benchmarks#
How does lightgraph compare to other force-directed network visualization libraries you can drop into a notebook or an R script? We benchmarked it against cytoscape.js, pyvis (vis-network), and networkD3 on identical graphs.
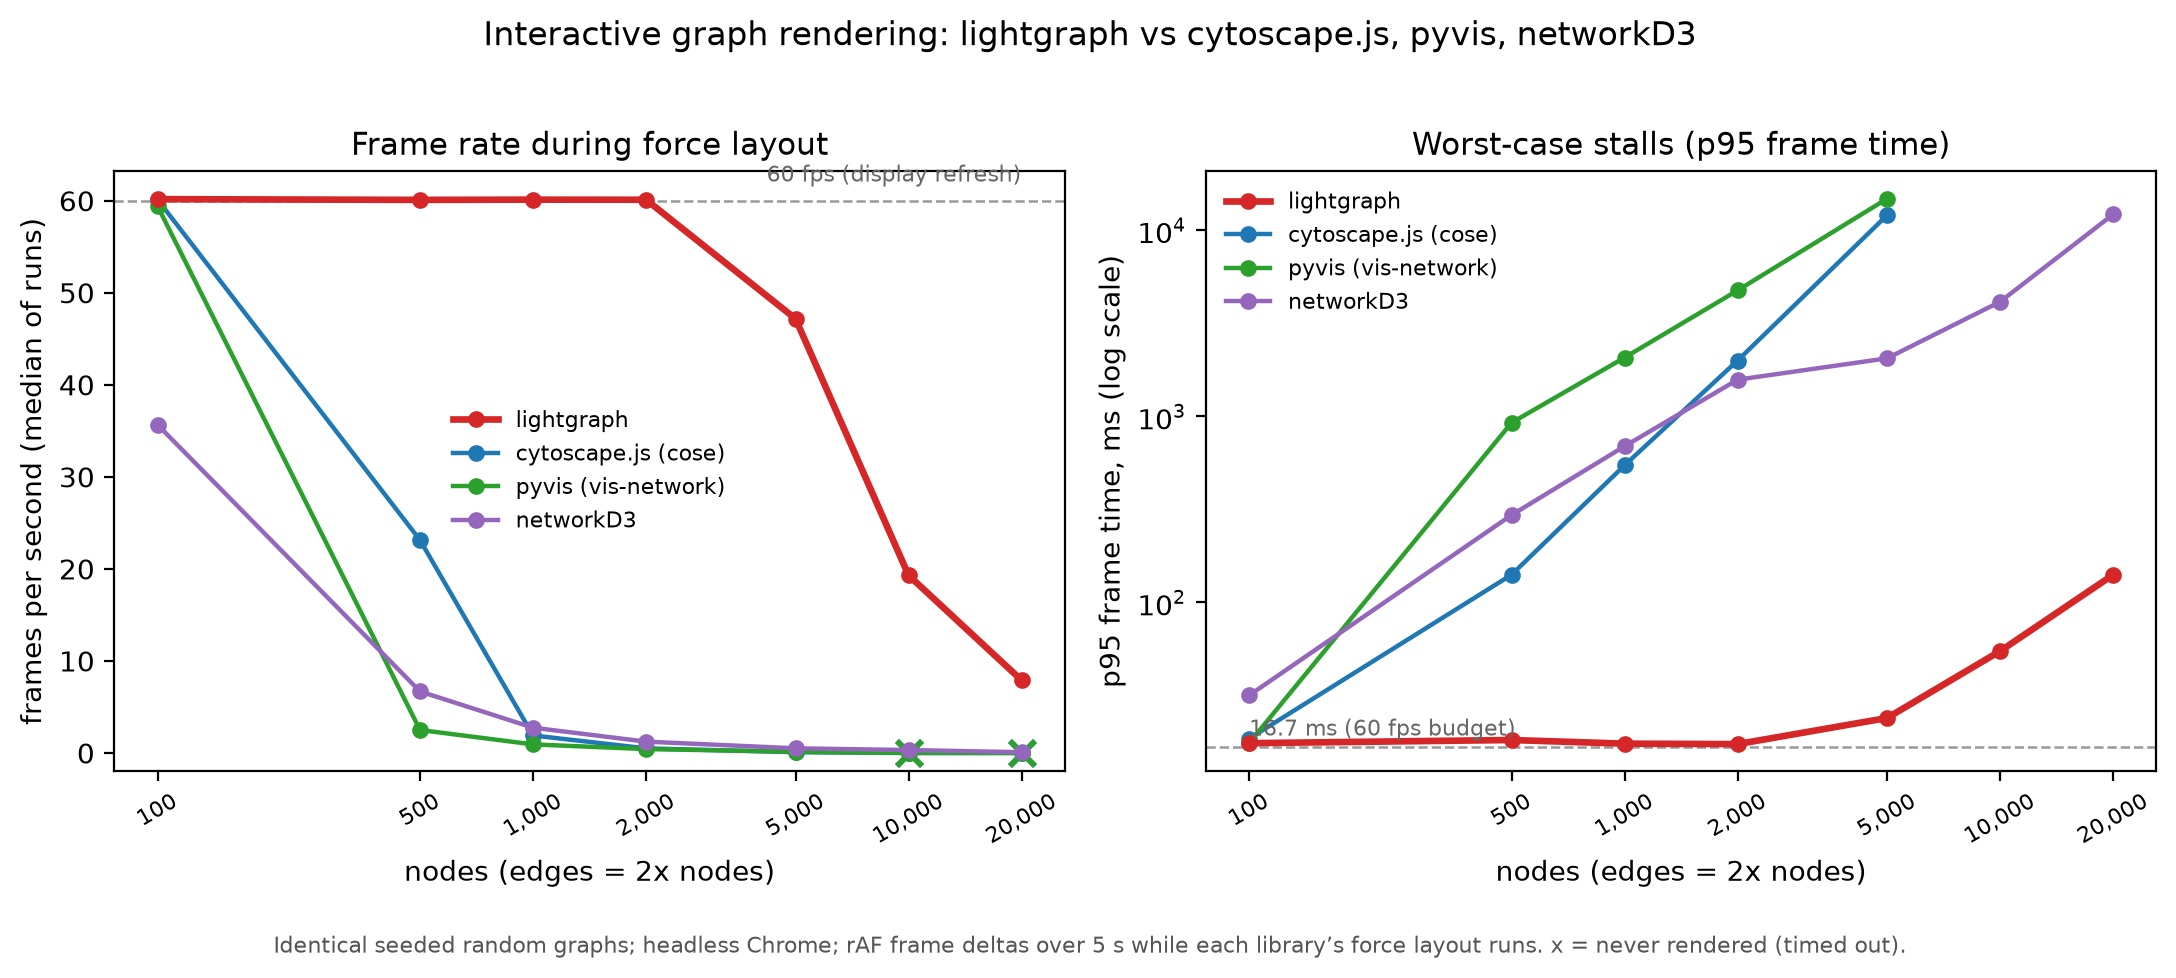
lightgraph is the only library still at the 60 fps display cap past 500 nodes, and the only one that keeps 10,000+ node graphs interactive at all.
Setup#
Every library renders the same graph at each size: seeded Erdős–Rényi random graphs (seed 42), from 100 nodes / 200 edges up to 20,000 nodes / 40,000 edges.
Each page embeds the same probe: wait for the library’s first non-empty canvas/SVG, wait 500 ms so the force layout is actively running, then measure
requestAnimationFrameframe deltas for 5 seconds.requestAnimationFramefires once per displayed frame regardless of which library scheduled it, so the deltas are the true on-screen frame rate while the layout runs.Headless Google Chrome on an Apple M1; medians of 3 runs (captured 2026-07-10). Library defaults, except node labels are turned off for lightgraph because the other libraries don’t draw labels by default. Versions: lightgraph 1.1.0 (with d3 v7), cytoscape.js 3.30.4 (cose layout), pyvis 0.3.2 on vis-network 9.1.2, networkD3 0.4.1.
Results#
Median frames per second during force layout (”—” = the library never produced a first render before the 120 s harness timeout):
Nodes |
Edges |
lightgraph |
cytoscape.js |
pyvis |
networkD3 |
|---|---|---|---|---|---|
100 |
200 |
60.2 |
60.1 |
59.4 |
35.7 |
500 |
1,000 |
60.1 |
23.1 |
2.5 |
6.7 |
1,000 |
2,000 |
60.1 |
1.9 |
0.9 |
2.7 |
2,000 |
4,000 |
60.1 |
0.5 |
0.4 |
1.2 |
5,000 |
10,000 |
47.2 |
0.1 |
0.1 |
0.5 |
10,000 |
20,000 |
19.3 |
— |
— |
0.3 |
20,000 |
40,000 |
7.9 |
— |
— |
0.1 |
Why the gap:
lightgraph batches all edge and node drawing into a handful of canvas paths per frame, culls offscreen elements, and coalesces rendering to one draw per animation frame.
cytoscape.js matches at 100 nodes, but the cose layout’s per-tick cost takes over quickly (p95 frame time is ~2 s at 2,000 nodes); at 10,000 nodes it never completes a first render.
pyvis (vis-network) runs Barnes–Hut stabilization on the main thread before the first paint: 46 s to first render at 5,000 nodes, timeout at 10,000.
networkD3 renders quickly at any size (the SVG appears immediately), but every simulation tick updates every SVG element, so interaction drops to 6.7 fps at 500 nodes and near-zero beyond 5,000.
Caveats#
These libraries use different force-layout engines, so this measures user-perceived interactivity while the layout runs — the practical “can I pan, zoom, and hover while it settles?” experience — not an isolated render-loop microbenchmark.
Reproducing#
The harness (shared graph generator, per-library page generators, headless
Chrome runner, and plotting script) lives in the
benchmark/ directory
of the repository; benchmark/benchmark.md documents the full
methodology and the step-by-step commands.